If you are attending statistics classes or need to make a certain analysis of data for your research, SPSS Statistics software will be an undeniable helper. Learn from the best correlation and regression examples on our blog to have a better understanding of how to use SPSS Statistics. All sample tasks that we post on our blog are supported with illustrations and detailed descriptions, so you can easily understand the process and be able to do everything by yourself.
Read the sample attentively and highlight the key moments. We will walk you through the complete procedure that you will use in SPSS Statistics, even if you have just started using this software. Also, if you are new to SPSS Statistics we recommend you to learn the interface of the program and basic functions to easily navigate in the program. To find more completed tasks and correlation and regression examples, check out the fist part of this regression statistics example and visit our blog.
You can also send us do my statistics homework free request when you need qualified help and get it any time .
Category Archives: Statistics assignment examples
Regression Statistics Example Using SPSS Statistics
No matter what major you have selected, with a high probability you will be taking statistics classes. Some research papers and theses require SPSS Statistics software for the research. This tool is especially helpful for handling large and complex data. With this software you can easily describe data, observe relationships between variables, and compare data sets. If statistics classes are not your cup of tea, don’t worry! On our blog we have collected several samples that will help you learn SPSS Statistics basic functions. You can also ask for do my statistics homework for me assistance any of our statistics experts.
In the following regression statistics example you will learn how to do correlation and linear regression. Also, you will find out how to find the relationship between average income and total expenditure using SPSS Statistics. We have included in the regression statistics example a detailed description of steps illustrated with screenshots that should help you clearly understand the information. Check the text below and you will find out that you can easily use this method in your own research. Continue reading
Linear Regression Example
Task:
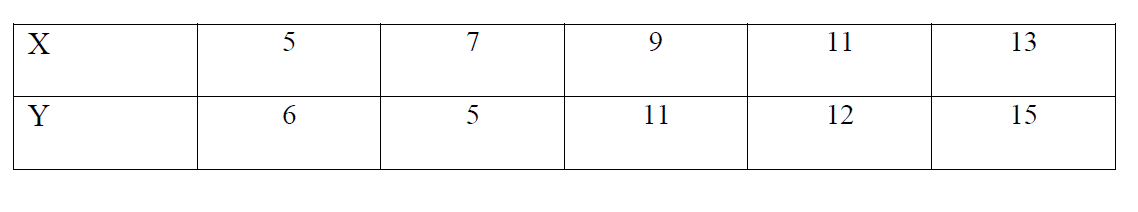
Based on the findings of two random variables, find the linear regression of X on Y and the selective correlation coefficient.
Statistics Assignment Sample: Discriminant Analysis
Problem statement:
Perform discriminant analysis on the results of measuring the length and width of iris flowers (SEPALLEN, SEPALWD, PETALLEN, PATELWD); identify the type of iris (SETOSA, VERSICOL, VIRGINIC) using Statistica software. Continue reading
Relative Frequency Distribution Example
Relative frequency – is how often something happens divided by all outcomes.
Example 1:
We have the frequency distribution of the chips “Pringles” at 40 different shops. Continue reading
How to Make Class Intervals in Statistics: Sample with Explanations
Groups of information in statistics in form of qualitative or quantitative attribute of set of variables are referred as data. Data can be either grouped or ungrouped.
Ungrouped data is a rough data which have been just gathered and no further steps were performed on this data. Continue reading
Cumulative Frequency Distribution Table Sample
As an example of the cumulative distribution, we will build and analyze the cumulative frequency distribution for rolling two standard number cubes.
Grouped Frequency Distribution Table Example
Frequency is the measure of how how often an event appears. The frequency distribution table is a tool which can help in comparing the frequencies of different events occurrence. There are two type of frequency distributions which are used in statistics: grouped frequency distribution and ungrouped frequency distribution. The first one is utilized for a high quantity of data, when it is impossible to list all of them in the table (“Grouped Frequency Distributions”, 2016). Continue reading
Example of Ungrouped Frequency Distribution Table
A set of data can be described with a frequency distribution. There are two types of frequency distributions: Grouped and Ungrouped (“Psychological statistics. Frequency Distributions”, N.p.). Continue reading
How to Construct a Relative Frequency Distribution
Suppose that as a result of some experiment, a sample x1, x2, x3 … xn has been obtained. Continue reading