If you are having difficulties with noise removal in Matlab, you might need to get acquainted with this stunning sample. It was completed by an expert from AssignmentShark who has vast knowledge in engineering. Our expert has prepared this sample with the aim to demonstrate how similar tasks should be completed. We hope it will help you to solve your own issues.
Also, you can make a conclusion of the quality of the work of our experts. If you can’t cope with any task on your own, including noise removal in Matlab, we’ll be glad to help you. Just fill the order form on our website, and someone from our team will contact you soon. When you are using our service you can be sure that you will receive a high-quality service for an affordable price.
You can ask for help with any type of assignments and disciplines, for example, we can meet your “pay someone to do my accounting homework” with ease, any time.
All the payments are released after you are satisfied with the order. Therefore, you have no need to worry. Be decisive and try our service right away!
Task:
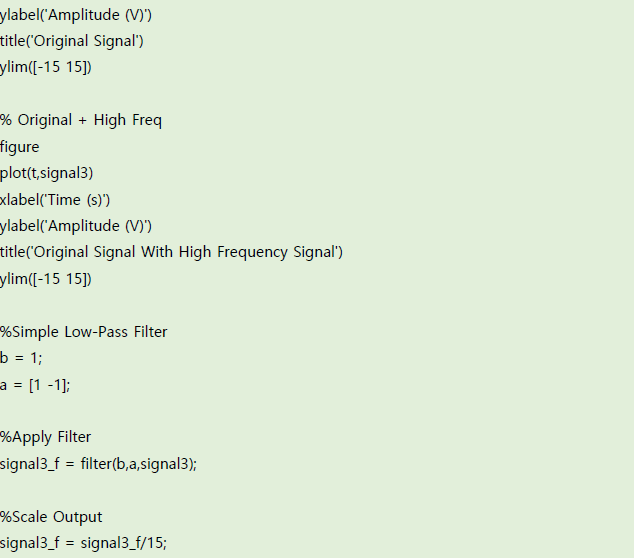
Use built-in Matlab filter functions to show how it can remove noise from a signal.
Solution:
Signal filtering is a common technique that is used in many fields of engineering and science. Filters remove unwanted signals and noise from a desired signal.
There are many different kinds of filters, including low-pass, high-pass, band-pass, and band-stop filters. In just the category of low-pass filters, there is a large collection of filters that famous engineers and mathematicians have invented, including Hanning, Hamming, Blackman, Kaiser, and Tukey windows.
In this example,we will look at how to use Matlab’s filter function to remove a high frequency signal from a desired signal.
The code below is used to remove high frequency interference from a lower frequency signal.
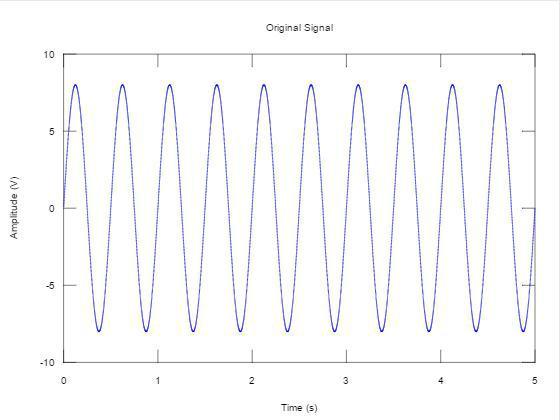
The first figure shows the original signal that we wish to hold.
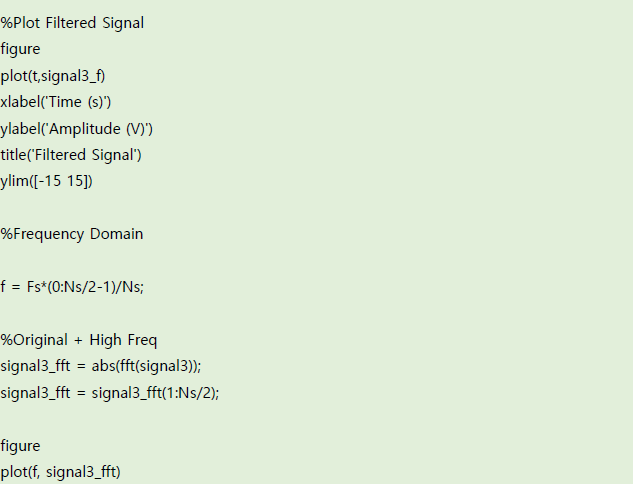
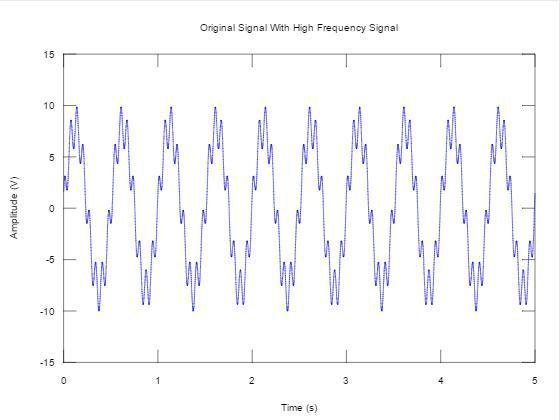
The next figure shows the original signal combined with interference at a frequency that is eight times higher.
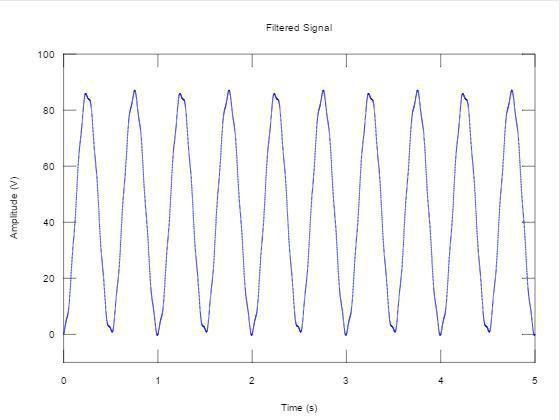
The third figure shows the signal after filtering with the simple low-pass filter. As we can see, the high frequency interference is gone, but the original signal has been distorted.
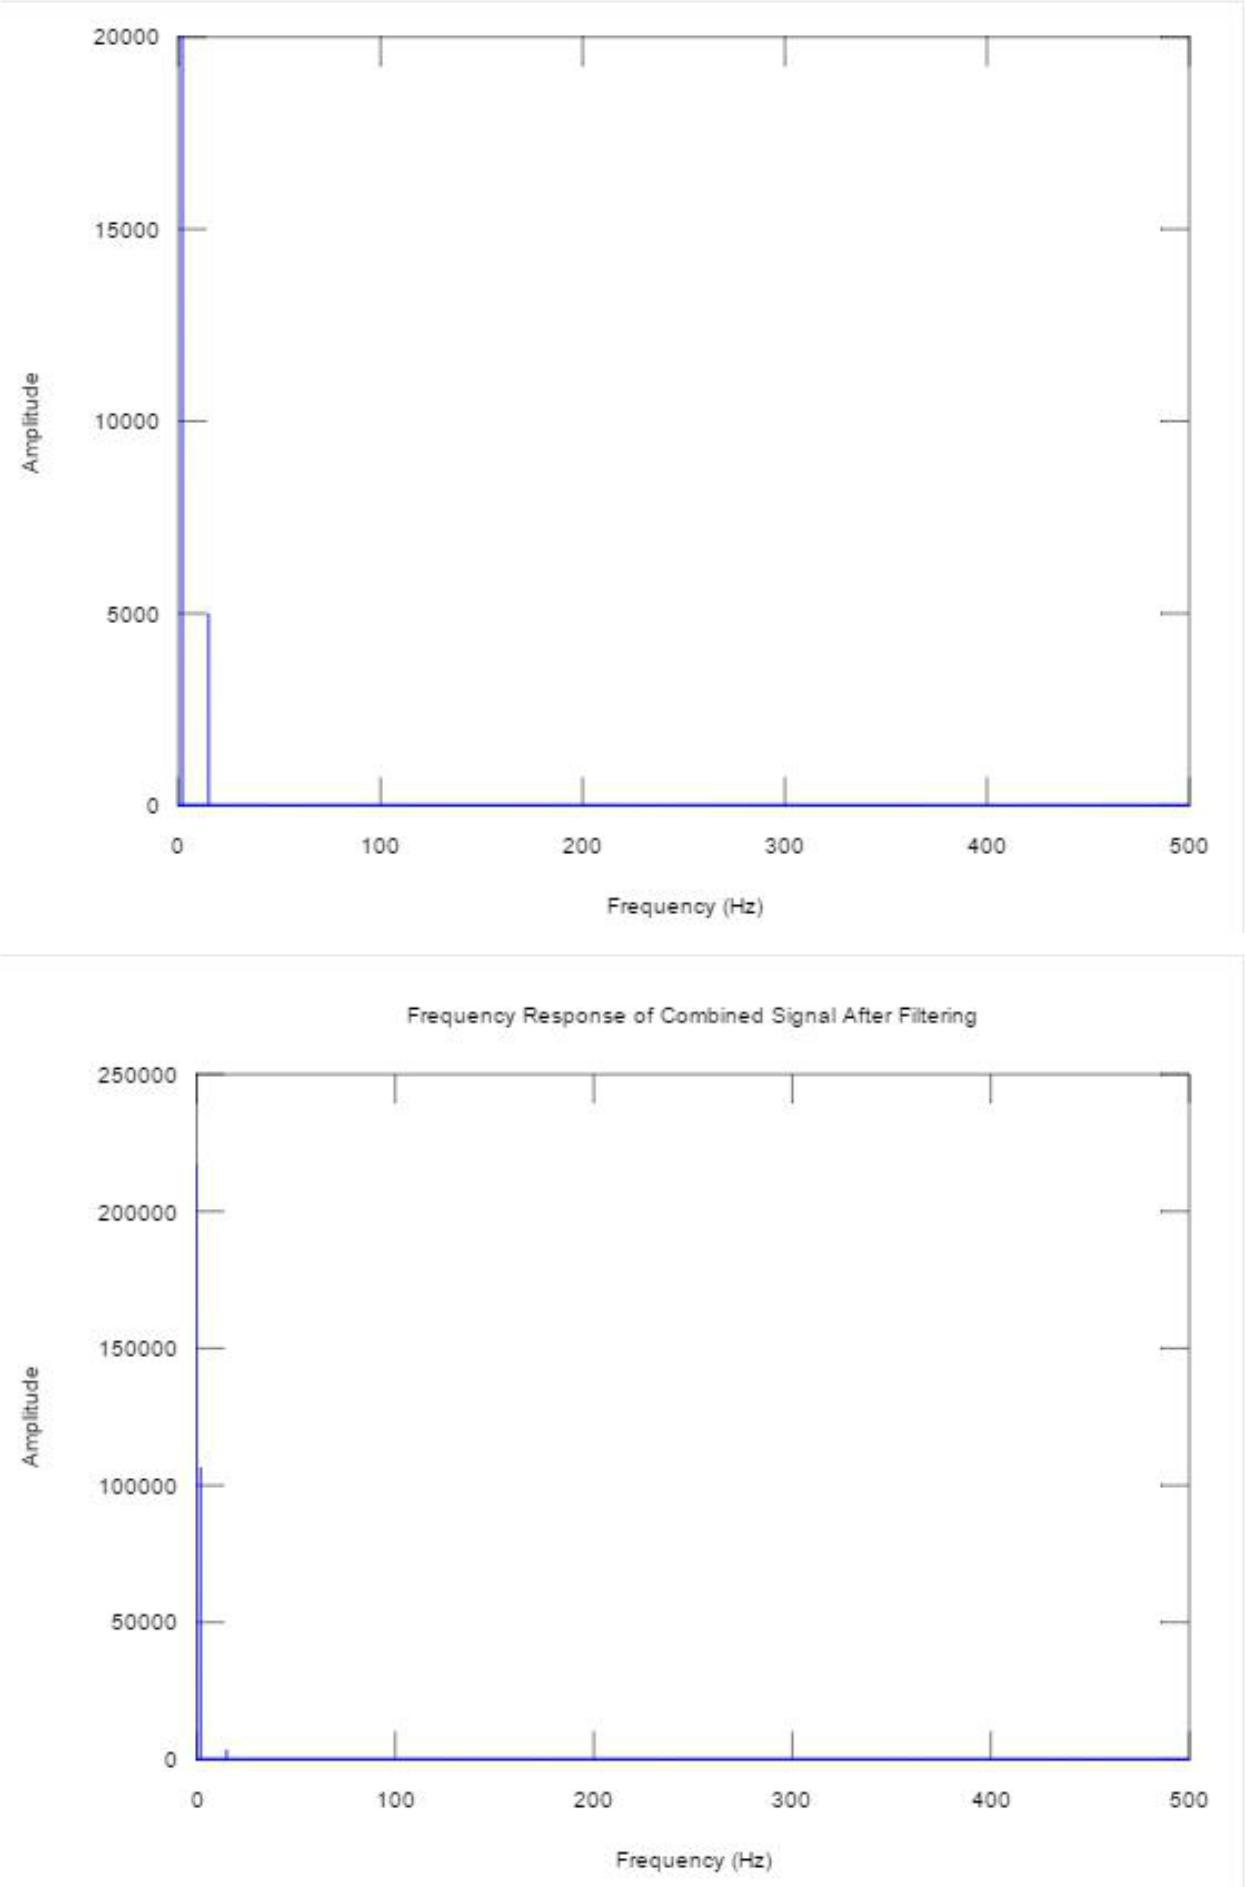
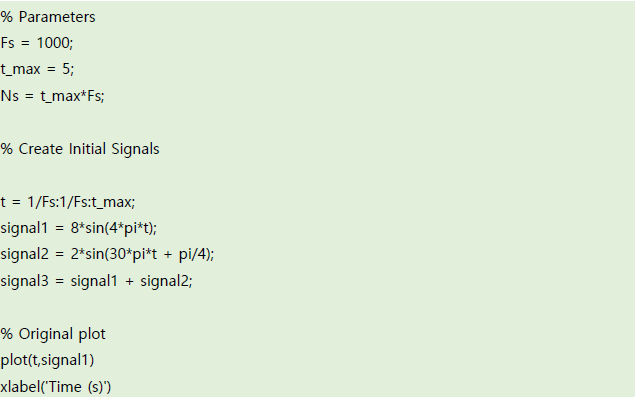
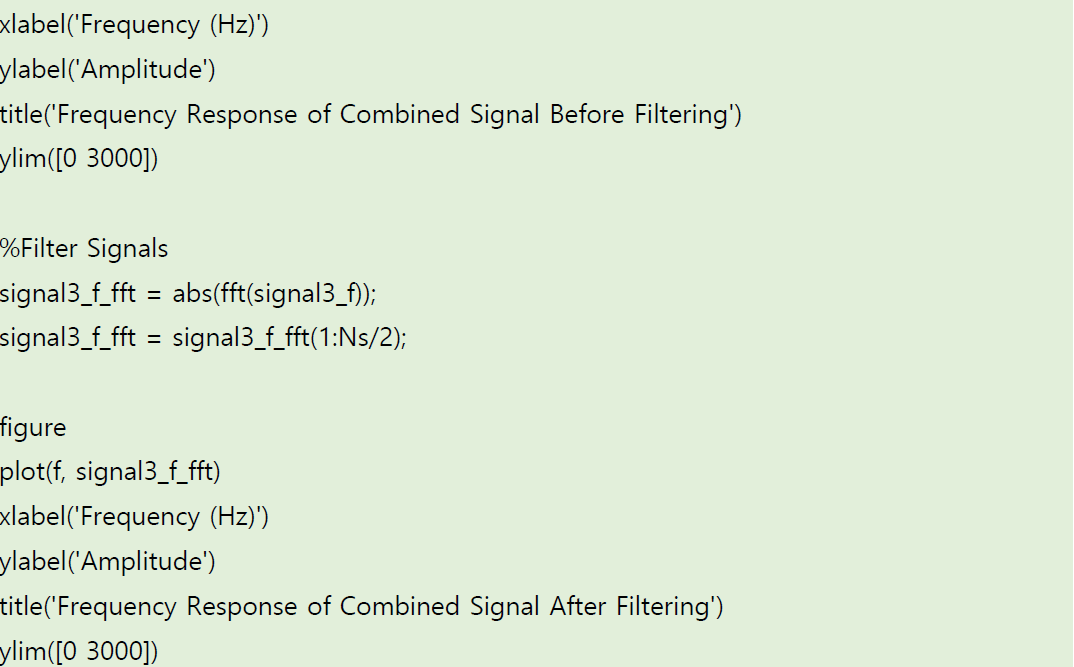
The fourth and fifth figures show the frequency responses of the signals from the combined signal before and after filtering. They are showing the Fourier transforms of the second and third figures.